


The Empirical Challenge to Agile Scaling Myths
Optimal team size is a core challenge in the Agile world. This challenge typically stems from the theoretical fear of productivity loss. For decades, conventional wisdom, backed by early psychological and management research, has converged on a consensus: small is inherently better. This view is well-supported by established research; for instance, early foundational studies by Hackman and Vidmar pinpointed the “ideal” size for complex tasks around 4.6 members. Similarly, industry frameworks like the Scrum Guide have long reinforced this sentiment by recommending 10 or fewer people, often invoking the classic “seven plus or minus two” rule.
But does our organisational data actually support these deeply ingrained theories?
We conducted a statistical analysis on 259 sprints and 12 teams across various domains to model team velocity as a function of team size. The results challenge these conventional theories and paint a surprisingly optimistic picture of scaling.
The “One Population” Fallacy: Why Context is Everything
Before attempting to model how team velocity scales, we had to address a crucial precondition. Can we combine all these teams into a single, uniform population?
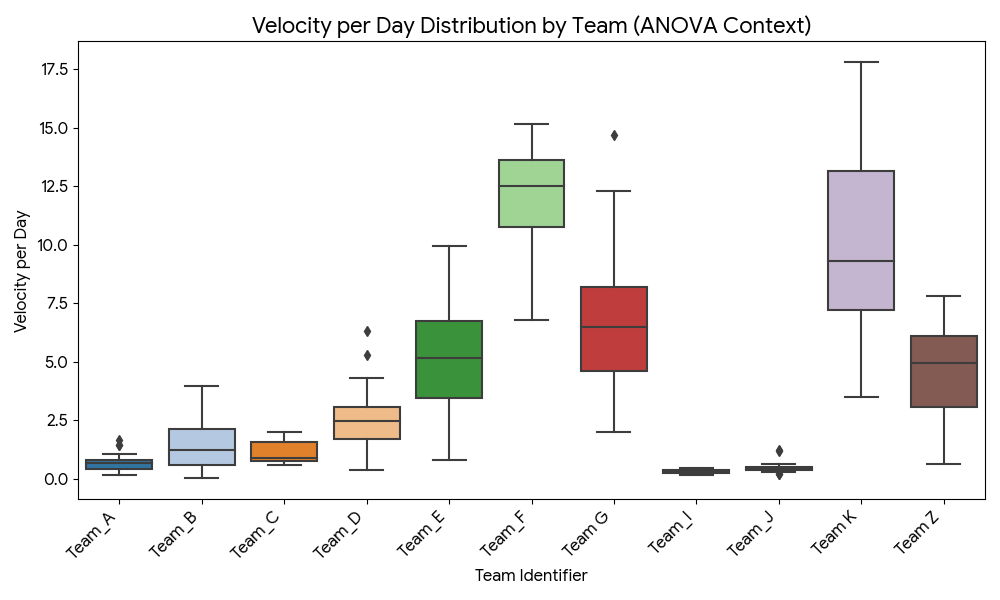
To test this, we used Analysis of Variance (ANOVA). This method that compares the variation in velocity between different teams against the variation within a single team. The results were conclusive: the F-statistic was a massive 92.58 with a p-value near zero ($p \approx 10^{-77}$). This extreme result forces us to reject the hypothesis that all teams share the same average velocity.
The implications are profound: we cannot statistically compare a team working on infrastructure head-to-head with one tackling complex compliance issues. Factors like domain complexity, specific tech stack, and team maturity create statistically distinct performance baselines. The team-by-team velocity distributions clearly visualise this heterogeneity, showing wide variation in median velocity and spread across groups. Treating them as one entity would mask critical differences.
Research Hypothesis: The Reduction Factor Challenge
Our central hypothesis was built upon the expectation that team performance ($V$) is a function of its ideal potential ($V_{\text{ideal}}$) multiplied by a Correction Factor ($CF(n)$) that quantifies lost efficiency as size ($n$) increases: $V = V_{\text{ideal}} \times CF(n)$. The statistical integrity of the established pseudo-theories demands that our empirical data aligns with models showing a significant, measurable reduction factor. We formally tested our observed velocity against three distinct theoretical reduction models:
The Brooks Model (Communication Overhead)
This model quantifies the famous Brooks’ Law, which posits that coordination overhead increases geometrically via the number of unique communication paths ($\frac{n(n-1)}{2}$). (This geometric scaling is also the mathematical foundation of Metcalfe’s Law, emphasising that network complexity rises sharply with size.) In the context of project management, Brooks’ model calculates the Correction Factor as $CF(n) = \frac{1}{1 + \alpha \cdot \frac{n(n-1)}{2}}$, where a statistically successful fit requires a significant positive coefficient ($\alpha > 0$), representing the measurable cost of each intercommunication path.
The Ringelmann Model (Social Loafing)
Rooted in social psychology, the Ringelmann Effect models the passive decline in individual effort when accountability is diffused across a larger team. This loss of motivation is often modeled logarithmically, $CF(n) = \max(0, 1 – r \cdot \log_{\text{base}}(n))$. Our test aimed to confirm if $r$, the strength of this effort, would decline, would be significantly greater than zero.
The Amdahl Model (Serial Work Constraint)
Drawing from parallel computing theory, Amdahl’s Law suggests a theoretical limit on scaling due to the irreducible fraction ($s$) of work that must be done sequentially. The corresponding Correction Factor, $CF(n) = \frac{1}{n \cdot s + (1 – s)}$, would show a low scaling potential if the serial fraction ($s$) proved to be large.
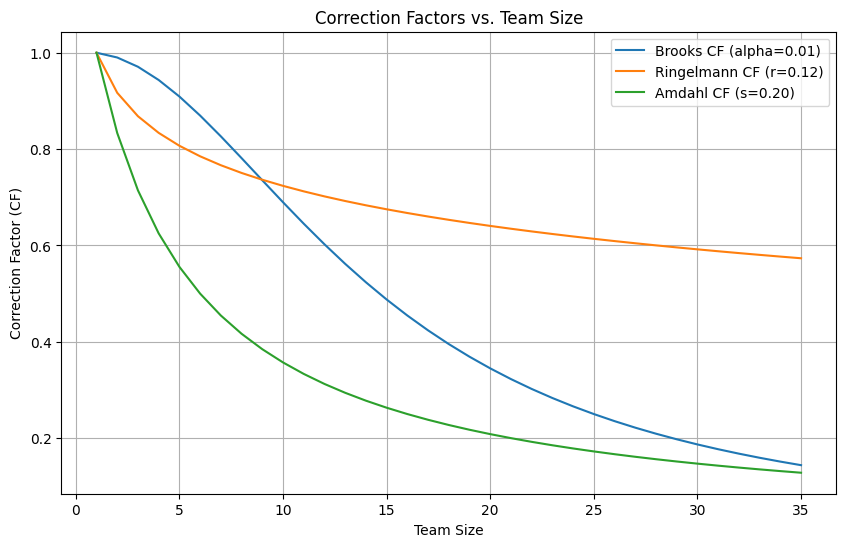
The subsequent phases of our analysis involved rigorous parameter optimisation for these theoretical forms and a direct comparison against simpler, empirical linear models to determine if these complex reduction factors are actually necessary to explain our organisation’s data.
The Reality of Linear Growth: No Crash, Just a Shift
Despite the severe performance penalties predicted by the models and the consensus favouring small teams, our data reveals that team velocity continues to grow linearly as team size increases. The predicted catastrophic decline simply does not appear. We found that the efficiency of this growth changes dramatically, suggesting a natural two-phase scaling model: small teams (0 to 10 members) operate in a near-ideal state with a steep slope ($R^2 = 0.73$), while large teams (11 to 30 members) maintain a strong linear relationship ($R^2 = 0.90$) but with a significantly flatter slope.
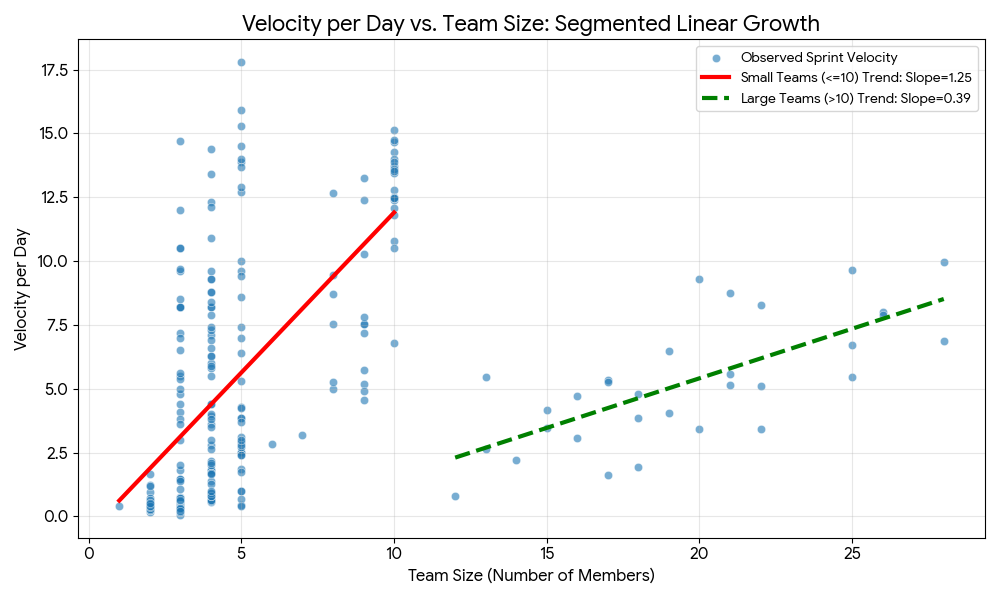
This segmented analysis confirms that while returns diminish slightly in larger teams, the relationship remains consistently positive. Team velocity does not crash.
Proportional Performance: The Cost of Scale (The Derivative View)
This segmentation reveals a critical distinction in proportional performance, or marginal productivity—the output gained from adding one more person. This marginal productivity is, in essence, the derivative (the slope) of the velocity curve.
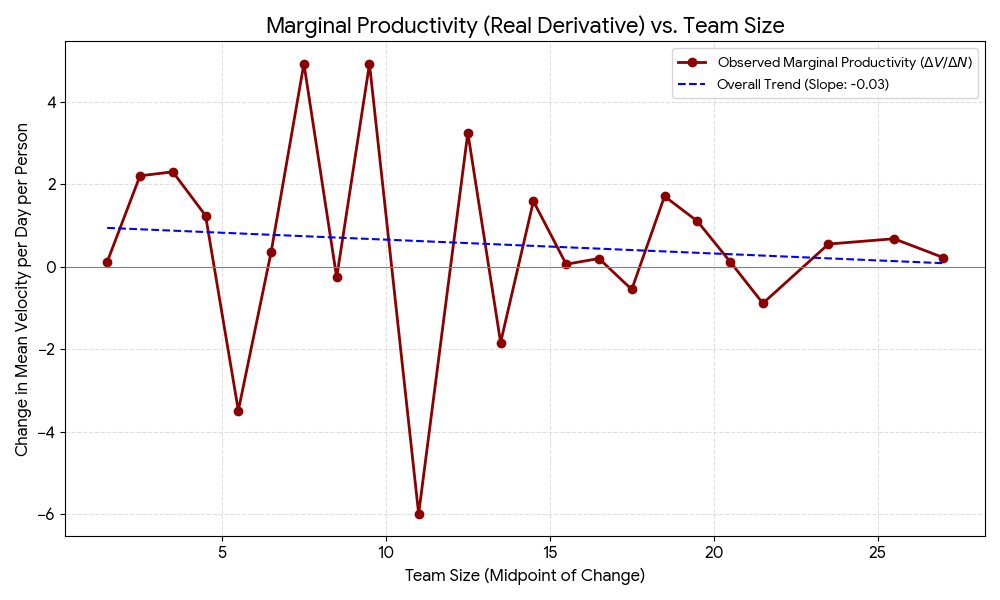
For the small teams (0-10 members), the average marginal productivity was approximately 0.92, meaning adding one person contributes almost a full, proportional unit of output. In contrast, for large teams (11-30 members), this efficiency dropped dramatically to approximately 0.20. While the team’s absolute output still increases (the slope is positive), the marginal productivity per person is only about one-fifth of what it is in a small team. The accompanying derivative plot, calculated directly from the change in mean team velocity, clearly visualises this major step-change and subsequent volatility in efficiency, confirming that organisational and communication overhead becomes a major limiting factor in reducing the productivity of each new member added.
Busting the “Doom Curves”: Theories Don’t Fit Our Reality
If the classic theories of team dysfunction were truly governing our organisation, then the relationship between size and velocity should follow a specific, concave curve, eventually turning negative.
To test this, we optimised the parameters of the theoretical correction factor models—such as Brooks’ Law and the Ringelmann Effect—to see if they could accurately describe our observed data. The idea was to find the optimal communication overhead ($\alpha$) or social loafing factor ($r$) that fits the truth.
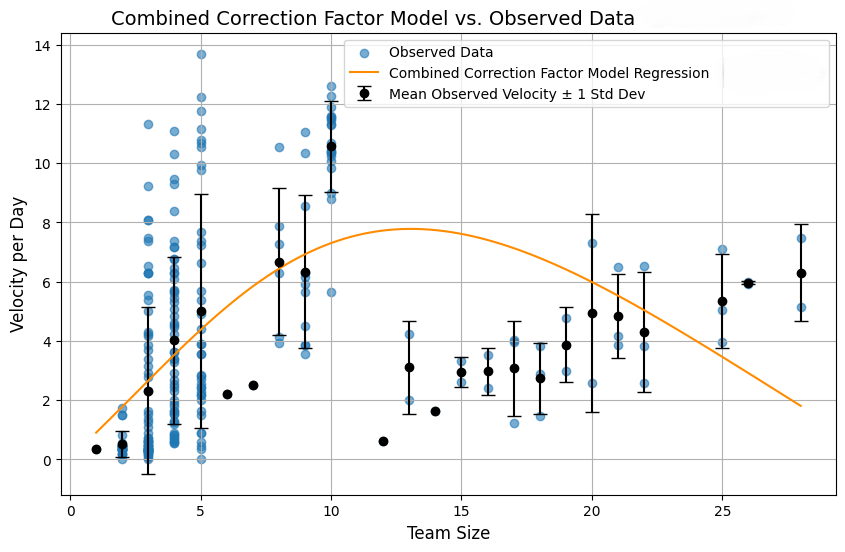
The results clearly show that these theoretical “doom curves” fail to capture the observed positive trend in our organisation. As the comparison chart shows, fitting these complex models results in poor alignment with the data. The optimisation algorithms consistently struggled to enforce a drop in productivity, indicating that the organisational structure effectively mitigates the geometric overhead penalties that these theories predict. Our teams managed to sustain growth, proving that organisational efficiency and psychological safety override the statistical inevitability of a velocity crash, at least within the observed range of 30 members.
A Note on Limitations of the Experiment
While our findings are robust and internally consistent within this dataset, a truly rigorous statistical study must transparently acknowledge its limitations. This analysis relies exclusively on Velocity per Day—a common but imperfect proxy for productivity—which is a simple measure and may not capture the complexity of output quality, technical debt, or long-term system health.
Furthermore, our ability to calculate a smooth, continuous derivative was limited by the discrete nature of team size; we had to aggregate velocity by the mean team size, which smooths out high-frequency noise but may obscure subtle, high-impact changes between team sizes not clearly represented in the raw data. Crucially, this study is confined to a single organisational context. Factors like pervasive employee dedication, a unified tooling environment, and common management styles are implicitly constant across this dataset, meaning the findings may not be directly translatable to organisations without similar operational maturity. These necessary caveats encourage us to view the “no crash” finding as a testament to this organisation’s success in managing scale, rather than a universal repudiation of the scaling theories.
Conclusion
The rigorous application of statistical methods, from ANOVA to segmented regression analysis, yields three robust and actionable conclusions for optimising scaling strategies.
Firstly, the overwhelming statistical significance of inter-team variance, confirmed by the ANOVA results, necessitates a contextual approach to performance management; cross-domain benchmarking is empirically unfounded.
Secondly, while the organisational velocity exhibits consistent absolute linear growth, fundamentally debunking the catastrophic crash hypothesis, the proportional efficiency—our marginal productivity—undergoes a severe and measurable reduction past the ten-member mark. This sharp drop from near-unity marginal gains confirms the proportional superiority of smaller team sizes.
Finally, the empirical failure of the optimised theoretical reduction factors (Brooks and Ringelmann) to model the observed trend strongly suggests that the organisation is successfully mitigating the predicted penalties through effective process and culture, transforming theoretical “doom curves” into manageable plateaus. In synthesis, our data indicates that while scaling is possible, maintaining proportional efficiency requires strategic, structure-based adaptation.
References
- Brooks, F. P. (1975). The Mythical Man-Month: Essays on Software Engineering. Addison-Wesley.
- Hackman, J.R., & Vidmar, N. (1970). “Effects of task complexity and group size on group performance.” Journal of Experimental Social Psychology, 6(1), 37-54.
- The Scrum Guide. (2020).
- Ingham, A. G., et al. (1974). “The Ringelmann Effect: Studies of group size and group performance”. Journal of Experimental Social Psychology, 10(4), 371–384.
- Amdahl, G. M. (1967). “Validity of the single processor approach to achieving large scale computing capabilities”. AFIPS Conference Proceedings, 30, 483–485.
Also read: From the Agile Promise to Industrial Bureaucracy: Farewell to a Betrayed Philosophy