



Every Python developer has measured code execution time at some point — whether to diagnose performance bottlenecks, benchmark different implementations, or simply evaluate an application’s efficiency. Understanding how long a function or script takes to run is essential for optimising performance, especially when working with large datasets, complex algorithms, or real-time applications.
Profiling
I’m sure that at one point in your (coding) life, you have used the time python library (or some similar framework), the following code should be familiar to you:
import time

start = time.time()
my_amazing_function()
end = time.time()
print(f"Execution time: {end - start} seconds")
But this method has some downsides:
- It only measures total execution time and doesn’t break down execution time for each function call.
- Doesn’t handle recursion.
- Doesn’t show any detailed statistics.
- Limited by system clock resolution (milliseconds on some OS).
What is Profiling?
Profiling in Python is analysing a program’s performance by measuring execution time, function calls, and resource usage. It helps identify bottlenecks and optimise code by showing which program parts take the most time.
Why is profiling helpful?
- Detects performance bottlenecks
- Optimises slow functions
- Understands recursive and nested function calls
- Analyses CPU and memory usage
How does it work?
Many frameworks provide profiling capabilities depending on the profiling type that we want to perform:
- CProfile: Built-in profiler for function calls and execution time.
- memory_profiler: Tracks memory usage per function.
- line_profiler: Profiles code line-by-line for deep analysis.
In this article, we are going to present CProfile, which is a built-in Python profiling framework written in C, so it is faster and has a lower overhead, making it suitable for profiling real-world applications.
Profiling with cProfile
Let’s try to profile the following code, which contains multiple chained function calls:
import time

def slow_function():
    """Performs a slow operation by summing a large range."""
    total = 0
    for i in range(1000000):
        total += i
    return total

def recursive_function(r):
    if r>0:
        quick_function()
        recursive_function(r-1)
    time.sleep(0.001)
    return True

def quick_function():
   return 1+1

def main_function():
    quick_function()
    slow_function()
    recursive_function(r=10)

main_function()
The output is as follows:
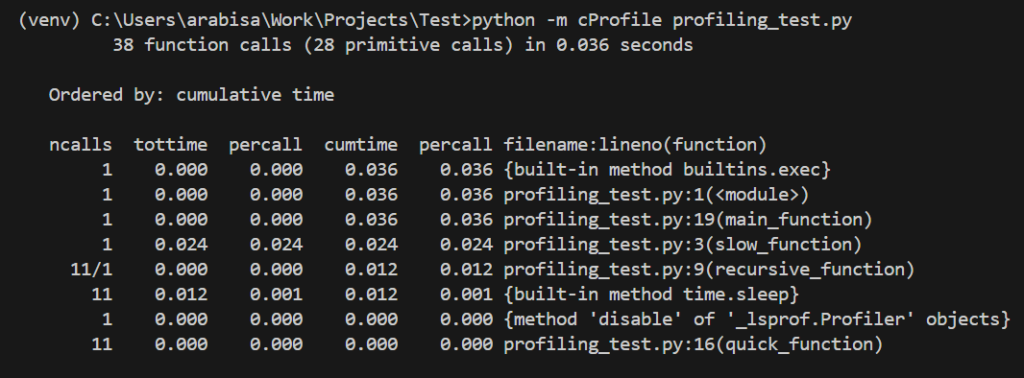
The output displays the total number of function calls and the number of primitive calls. Primitive calls are non-recursive calls, since recursive_function calls itself 10 times in the script, we only have 28 primitive calls out of 38 total function calls.
We also get more detailed information about each function that was called in the script:
- ncalls: Number of times the function was called.
- tottime: Total time spent in function (excluding subcalls).
- cumtime: Cumulative time (including subcalls).
In the tot time column, slow_function has the highest execution time of 24ms. If we used the time library, we would only get the cumulative time, which would give us no real insight into code execution.
Visualising profiling data with SnakeViz
SnakeViz is an interactive visualisation tool for profiling data generated by Python’s cProfile module. It provides easy-to-read plots to help visualise where time is spent in a program.
Installation
First, you need to install the snakeviz package. You can do this via pip:
pip install snakevizUsage
First, we will need to adjust the cProfile command to generate the profiling as a file instead of printing it on the terminal:
python -m cProfile -o profile_data profiling_test.pyThen, we invoke the snakeviz tool passing as an argument the profiling data path we generated above:

The following interactive web UI shows:

SnakeViz has two visualisation styles, icicle (the default) and sunburst.
In the icicle visualisation style, rectangles represent functions. A root function is the top-most rectangle, with functions it calls below it, then the functions those call below them, and so on. The amount of time spent inside a function is represented by the width of the rectangle. A rectangle that stretches across most of the visualisation represents a function that is taking up most of the time of its calling function. In contrast, a skinny rectangle represents a function that uses hardly any time at all.
In the figure above we can see that the slow_function takes most execution time, then recursive_function (which itself calls the sleep function). We can barely see the quick_function because it is so fast that its execution time is irrelevant in comparison to the two other functions.
When we hover the mouse over a rectangle, we see a quick summary on the left. Here, I’m hovering over slow_function, we can see that this function takes 67.15% of its calling function (main_function) time.
Visualisation
SnakeViz has multiple controls that affect the visualisation:
- Reset Zoom: If you’ve zoomed into a profile by clicking on the visualisation, clicking the “Reset Zoom” button will reset the visualisation to the currently selected root function.
- Reset Root: If you’ve changed the root function by clicking on the stats table, clicking the “Reset Root” button will reset the visualisation to the root function..
- Style: To switch between the icicle and sunburst visualisation styles.
- Depth: Controls how deep into the call stack SnakeViz goes when building the visualisation. Anything below this depth will not be shown until you zoom in by clicking on a new function deeper in the call stack.
- Cutoff: Controls the display of functions that take up very little of their parents’ cumulative time. If a function’s cumulative time divided by its parent’s cumulative time is less than the currently set cutoff, then that function will be displayed, but none of its sub-functions will be.
Conclusion
Profiling is essential for analysing Python code efficiency, as it helps developers identify slow functions and performance bottlenecks. It also provides detailed execution statistics with minimal overhead, making it a valuable tool for optimisation. By integrating cProfile into your projects and pairing it with SnakeViz, you can gain valuable insights through visualisations, making optimisation more intuitive and effective.