



When deploying the Elastic Kubernetes integration via Fleet for monitoring your Kubernetes clusters, you often don’t need to enable every single dataset and integration offered by default. This is particularly true if you have a specific monitoring focus or want to reduce the resource overhead and noise from irrelevant data streams.
Why Selective Deployment Matters
The Kubernetes integration for the Elastic Agent is comprehensive, collecting metrics, logs, and events from various sources: Kubelet, kube-state-metrics, API servers, proxies, and more. By default, many installations enable all these streams, which can lead to:
- Increased Data Volume: Higher costs and storage requirements in Elasticsearch.
- Higher Resource Usage: More CPU and memory consumption by the Elastic Agents.
- Monitoring Clutter: Unnecessary data streams making it harder to focus on critical information.
By selectively enabling inputs, you ensure your Elastic Agents only collect the data streams you actually need.
The Key Configuration: Package Policies and Inputs
The core of this selective deployment lies within the Fleet Agent Policy definition in your Kibana configuration (eck-kibana manifest, likely within an ECK deployment).
Within the xpack.fleet.agentPolicies section, you define the policy for your Kubernetes Agents. The critical part is under the package_policies for the kubernetes package:
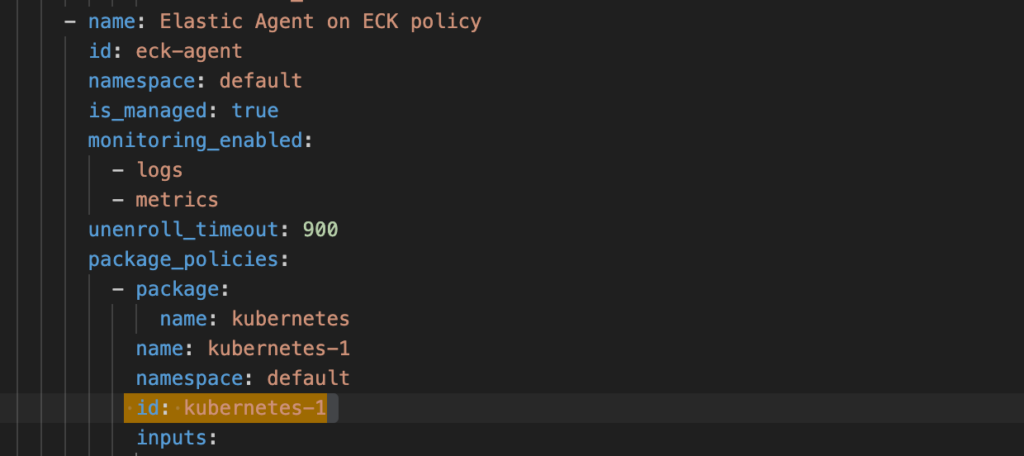
The input map is where you override the default settings for the integration’s various data streams (datasets). Each key in the input map corresponds to a specific data stream name within the Kubernetes package.
✅ Enabling Only Essential Kubernetes Datasets
The provided configuration demonstrates a highly focused deployment, enabling only the essential datasets for cluster health and container visibility: Kubelet Metrics, Kube-State-Metrics, and Container Logs.
1. Kubelet Metrics
Kubelet metrics provide crucial information about the health and resource utilisation of nodes and the pods running on them.
| Data Stream Name | Description | Configuration |
| kubelet-kubernetes/metrics | Node and Pod resource usage, health checks. | enabled: true |

2. Kube-State-Metrics
Kube-State-Metrics provides visibility into the state of Kubernetes objects (Deployments, Pods, Services, etc.). This is fundamental for understanding your application’s health and scaling.
| Data Stream Name | Description | Configuration |
| kube-state-metrics-kubernetes/metrics | State of Kubernetes objects. | enabled: true |

3. Container Logs
Capturing container logs is non-negotiable for troubleshooting and application visibility. The container-logs-filestream input uses the Elastic Agent’s dedicated log collection capability.
| Data Stream Name | Description | Configuration |
| container-logs-filestream | Logs from running containers. | enabled: true |

? Disabling Unneeded Datasets
The remaining datasets are explicitly disabled by setting enabled: false. This mechanism overrides the package’s default ‘enabled’ status for these inputs, ensuring the agents do not attempt to collect this data.
| Data Stream Name | Source | Configuration |
| kube-apiserver-kubernetes/metrics | Kubernetes API Server | enabled: false |
| kube-proxy-kubernetes/metrics | Kubernetes Proxy | enabled: false |
| kube-scheduler-kubernetes/metrics | Kubernetes Scheduler | enabled: false |
| kube-controller-manager-kubernetes/metrics | Kubernetes Controller Manager | enabled: false |
| events-kubernetes/metrics | Kubernetes Events (often collected elsewhere) | enabled: false |
| audit-logs-filestream | Kubernetes Audit Logs | enabled: false |
The Complete Selective Configuration Snippet
For reference, the complete and focused configuration for the Kubernetes Package Policy looks like this:

By using this approach, you gain granular control over the data streams collected from your Kubernetes cluster, allowing for a more efficient and targeted monitoring strategy deployed via the Elastic Agent and Fleet.